Monitoring 6WIND vRouter with InfluxDB and Nagios
6WIND vRouter provides monitoring functionalities, including SNMP and KPIs (Key Performance Indicators) exported to a time-series database.
In this document, we will explore here how to integrate both the InfluxDB time-series database and SNMP in Nagios Core. We will configure a simple Nagios Core server which will survey CPU usage and processes of a vRouter.
Environment
For our demonstration we will use a vRouter and a Debian 10 server with a standard Nagios Core and InfluxDB installation for monitoring.
Nagios Core and InfluxDB will be installed on the same server for monitoring. Please see both Debian, InfluxDB and Nagios websites for documentation about their installation.
The vRouter will have internal IP 10.0.2.1 and is named MyvRouter. It’s important to maintain consistency between our vRouter hostname and its name in Nagios Core’s configuration.
The monitoring server will have IP 10.0.2.2.
The InfluxDB database will be named telegraf.
About Nagios Core
Nagios Core is based on the use of plugins to know how and what to monitor. Nagios Core is distributed with some fundamental plugins but it’s still needed to build upon them to monitor a vRouter. The Nagios community proposes many plugins and Nagios Core itself is well documented.
In Nagios, a monitored host is a collection of services using commands to check status and values reported by network hosts. Values are then compared to predefined warning and critical intervals before sending notifications. Hosts and commands are defined in definition files.
We will add a host, services and commands definitions to monitor our vRouter host with our Nagios Core server.
The complete explanation of Nagios Core is beyond this article, please refer to https://support.nagios.com/kb/article/nagios-core-installing-nagios-core-from-source-96.html#Debian.
On Debian 10, as root, a functional Nagios installation is available with apt :
apt install nagios4
It will install the Apache web server and all needed dependencies.
Verify Apache has all default modules and these two are enabled:
a2enmod auth_digest
a2enmod authz_groupfile
For convenience, we add a folder for host definitions:
mkdir /etc/nagios4/hosts
And add the following line to /etc/nagios4/nagios.cfg :
cfg_dir=/etc/nagios4/hosts
And then restart Apache and Nagios:
systemctl restart apache2
systemctl restart nagios4
After that, Nagios will be available at: http://10.0.2.2/nagios4.
We will add configurations in /etc/nagios4 and plugins in /usr/lib/nagios/plugins.
InfluxDB Monitoring
vRouter Configuration
The KPI monitoring feature of the InfluxDB and Telegraf integration in vRouter provides the ability to monitor and export KPIs to an InfluxDB time-series database. We configure the Telegraf agent to export KPIs to our InfluxDB database. You will find detailed instructions in the 6WIND vRouter User Guide.
Here is the most basic setup:
vrouter running config# vrf main kpi
vrouter running kpi/# telegraf
vrouter running telegraf/# influxdb-output url http://10.0.2.2:8086 database telegraf
vrouter running telegraf/# commit
Installation
We need to install InfluxDB on our monitoring server, 10.0.2.2. It will receive KPIs from the vRouter.
On Linux Debian 10, a basic installation of InfluxDB is available with the command:
apt install influxdb
More details are available on the official site: https://docs.influxdata.com/influxdb/v1.7/introduction/installation .
Checking the CPU Usage with InfluxDB
Now we can add an InfluxDB support and command definition to our Nagios Core installation.
InfluxDB is not an integrated feature of Nagios Core. We will use the Nagios Core plugin architecture to add it. influx-nagios-plugin is an efficient and simple enough plugin written in Python.
It’s available at https://github.com/shaharke/influx-nagios-plugin or by pip.
Installation
On Debian Linux 10, as user root:
apt install python-pip
pip install influx-nagios-plugin
it will install the check_influx command in /usr/local/bin.
Check the installation path with:
pip show --files influx-nagios-plugin
And finally, copy the check_influx executable to Nagios’ plugin folder. In a default installation of Nagios Core, the plugin folder is /usr/lib/nagios/plugins.
How it Works
The plugin consists in the command check_influx. It allows you to check the result of a InfluxDB query in a range.
check_influx sends a request to an InfluxDB server and checks if the answer is between the warning threshold and critical threshold before returning the state to Nagios.
Notice: check_influx takes the IP of the host running influxdb services, not the host monitored by Nagios.
Example of checking the last value of busy in system-cpu-usage series for a host named MyvRouter in an InfluxDB server of IP 10.0.2.2. A warning notification will be sent if the value is more than 50, a critical alert if more than 80.
check_influx -h 10.0.2.2 -u root -p "influxPWD" -d telegraf \
-q 'SELECT last(busy) FROM "system-cpu-usage" \
    WHERE host =~ /^MyvRouter/ AND cpu=~ /^cpu0/' \
-w 50 -c 80
Nagios Command Definition
Now that we have the check_influx plugin for Nagios Core, we add definitions of commands and services leveraging it to monitor the vRouter.
In the command definition file of your Nagios Core installation, by default /etc/nagios4/objects/commands.cfg, we add the following definition:
# 'check_influx' command definition
define command {
 command_name check_influx
 command_line $USER1$/check_influx -h $ARG1$ -u $ARG2$ -p $ARG3$ -d $ARG4$ -q $ARG5$ -m $ARG6$ -w $ARG7$ -c $ARG8$
}
Nagios Service Definition
And then, to add the service, Nagios will check for a vRouter host. We will define a new host definition to monitor the CPU load for that host. Please see the Nagios Core documentation about host definition.
Notice: InfluxDB host IP, login, password, data series name and a request are passed as an argument to the Nagios command.
We create a host definition file: /etc/nagios4/objects/myvrouter.cfg and add a service “Check Cpu Load”:
define host {
 Host_name		myvRouter
 Address		10.0.2.1
}

define service {
 Use				service
 Host_name			MyvRouter
 Service_description	Check Cpu Load
 Check_command		check_influx!10.0.2.2!root!influxPWD!telegraf!'SELECT last(busy) FROM "system-cpu-usage" WHERE host =~ /^myvRouter/ AND cpu=~ /^cpu0/'!""!50!80
}
The request
SELECT last(busy) FROM "system-cpu-usage" WHERE host =~ /^myvRouter/ AND cpu=~ /^cpu0/
retrieves the load in percent of the CPU 0 of the vRouter host. We may need to adjust that request for your setup for a specific CPU or averaging all CPUs.
With the parameters 50 and 80 to our check_influx plugin, Nagios Core will make a warning alert at 50% of CPU usage, and a critical alert at 80%.
Please, see InfluxDB documentation about request syntax.
After a restart of Nagios, Nagios will periodically monitor InfluxDB data.
SNMP Monitoring
vRouter Configuration
First, SNMP service and connection to SNMP port from our monitoring server need to be enabled. You will find detailed instructions in the 6WIND vRouter User Guide.
Snips of configuration:
/ vrf main firewall ipv4 filter
input
rule 10 description "snmp" protocol udp destination 161 source address 10.0.2.2/32 action accept

/ vrf main
snmp
enabled true
static-info
contact itsystem@6wind.com
..
community public
authorization read-only
source 10.0.2.0/24
..
traps
destination 10.0.2.2 port 162 protocol udp notification-type TRAP2 community public
link-status-check frequency 60s enabled true
process-check frequency 2s enabled true

commit
Passive Checking of SNMP Traps
In this section, we will add support to Nagios for receiving and monitoring SNMP traps sent by our vRouter.
First, we need to install two tools on our monitoring server: Snmptrapd and Snmptt.
Snmptrapd will receive SNMP traps and will send them to Snmptt which filters and transfers them to Nagios.
For Example:
EVENT mteTriggerFired .1.3.6.1.2.1.88.2.0.1 "Status Events" Normal
FORMAT Notification that the trigger indicated by the object $*
EXEC /usr/share/nagios4/plugins/eventhandlers/submit_check_result $r "snmp_traps" 1 "Notification that the trigger indicated by the object $*"
That rule will take effect when receiving a trap from a vRouter, like an error in a process or a loss of connection. It will execute the submit_check_result script which will pass the event to Nagios.
And then we add Nagios definitions for adding the Snmp Trap service to our vRouter host.
Installation
# apt install snmptt snmptrapd snmp-mibs-downloader
Snmptt needs MIBS definitions to function. Edit /etc/snmp/snmp.conf and comment out with # the following line:
mibs :
Change configurations for Snmptrapd and Snmptt (see Configuration Files section, lower).
Nagios Service Definition
We add a new template service for Snmp traps. It will be used for our host vRouter.
In /etc/nagios4/objects/templates.cfg, add the following definition:
define service {
name                    trap-service
use                     generic-host
register                0
service_description     snmp_traps
is_volatile             1
check_command           check-host-alive
flap_detection_enabled  0
process_perf_data       0
max_check_attempts      1
normal_check_interval   1
retry_check_interval    1
passive_checks_enabled  1
check_period            24x7
notification_interval   31536000
active_checks_enabled   0
notification_options    w,u,c
}
And then, we add a proper service using that template in our vRouter host, /etc/nagios4/objects/myvrouter.cfg:
define service {
use	 			trap-service
host_name			myvRouter
}
After a restart:
systemctl restart snmptrapd
systemctl restart snmptt
systemctl restart nagios4
Then, Nagios will monitor SNMP trap notifications.
Configuration Files
/etc/snmp/snmptrapd.conf:
traphandle default /usr/sbin/snmptthandler
disableAuthorization yes
/etc/snmp/snmptt.ini:
[General]
snmptt_system_name =

mode = daemon
multiple_event = 1
dns_enable = 0
strip_domain = 0
strip_domain_list = <
/etc/snmp/snmptt.conf:
EVENT CatchAll .1.* "snmp_traps" Critical
FORMAT $D
EXEC /usr/local/nagios/libexec/eventhandlers/submit_check_result "$r" "snmp_traps" 2 "$O: $1 $2 $3 $4 $5"
#
EVENT netSnmpExampleHeartbeatRate .1.3.6.1.4.1.8072.2.3.0.1 "netSnmpExampleHeartbeatRate" Normal
FORMAT SNMP netSnmpExampleHeartbeatRate
EXEC /usr/local/nagios/libexec/eventhandlers/submit_check_result "$r" "snmp_traps" "$s" "$@" "" "netSnmpExampleHeartbeatRate"
#
EVENT nsNotifyStart .1.3.6.1.4.1.8072.4.0.1 "Status Events" Normal
FORMAT An indication that the agent has started running. $*
EXEC /usr/local/nagios/libexec/eventhandlers/submit_check_result $r "snmp_traps" 1 "An indication that the agent has started running. $*"
SDESC
An indication that the agent has started running.
Variables:
EDESC
#
#
#
EVENT nsNotifyShutdown .1.3.6.1.4.1.8072.4.0.2 "Status Events" Normal
FORMAT An indication that the agent is in the process of being shut down. $*
EXEC /usr/local/nagios/libexec/eventhandlers/submit_check_result $r "snmp_traps" 1 "An indication that the agent is in the process of being shut down. $*"
SDESC
An indication that the agent is in the process of being shut down.
Variables:
EDESC
#
#
#
EVENT nsNotifyRestart .1.3.6.1.4.1.8072.4.0.3 "Status Events" Normal
FORMAT An indication that the agent has been restarted. $*
EXEC /usr/local/nagios/libexec/eventhandlers/submit_check_result $r "snmp_traps" 1 "An indication that the agent has been restarted. $*"
SDESC
An indication that the agent has been restarted.
This does not imply anything about whether the configuration has
changed or not (unlike the standard coldStart or warmStart traps)
Variables:
EDESC
#
#
#
#
EVENT pmNewRoleNotification .1.3.6.1.2.1.124.0.1 "Status Events" Normal
FORMAT The pmNewRoleNotification is sent when an agent is configured $*
EXEC /usr/local/nagios/libexec/eventhandlers/submit_check_result $r "snmp_traps" 1 "The pmNewRoleNotification is sent when an agent is configured $*"
SDESC
The pmNewRoleNotification is sent when an agent is configured
with its first instance of a previously unused role string
(not every time a new element is given a particular role).
An instance of the pmRoleStatus object is sent containing
the new roleString in its index.  In the event that two or
more elements are given the same role simultaneously, it is an
implementation-dependent matter as to which pmRoleTable
instance will be included in the notification.
Variables:
  1: pmRoleStatus
EDESC
#
#
#
EVENT pmNewCapabilityNotification .1.3.6.1.2.1.124.0.2 "Status Events" Normal
FORMAT The pmNewCapabilityNotification is sent when an agent $*
EXEC /usr/local/nagios/libexec/eventhandlers/submit_check_result $r "snmp_traps" 1 "The pmNewCapabilityNotification is sent when an agent $*"
SDESC
The pmNewCapabilityNotification is sent when an agent
gains a new capability that did not previously exist in any
element on the system (not every time an element gains a
particular capability).
An instance of the pmCapabilitiesType object is sent containing
the identity of the new capability.  In the event that two or
more elements gain the same capability simultaneously, it is an
implementation-dependent matter as to which pmCapabilitiesType
instance will be included in the notification.
Variables:
  1: pmCapabilitiesType
EDESC
#
#
#
EVENT pmAbnormalTermNotification .1.3.6.1.2.1.124.0.3 "Status Events" Normal
FORMAT The pmAbnormalTermNotification is sent when a policy's $*
EXEC /usr/local/nagios/libexec/eventhandlers/submit_check_result $r "snmp_traps" 1 "The pmAbnormalTermNotification is sent when a policy's $*"
SDESC
The pmAbnormalTermNotification is sent when a policy's
pmPolicyAbnormalTerminations gauge value changes from zero to
any value greater than zero and no such notification has been
sent for that policy in the last 5 minutes.
The notification contains an instance of the pmTrackingPEInfo
object where the pmPolicyIndex component of the index
identifies the associated policy and the rest of the index
identifies an element on which the policy failed.
Variables:
  1: pmTrackingPEInfo
EDESC
#
#
#
EVENT mteTriggerFired .1.3.6.1.2.1.88.2.0.1 "Status Events" Normal
FORMAT Notification that the trigger indicated by the object $*
EXEC /usr/local/nagios/libexec/eventhandlers/submit_check_result $r "snmp_traps" 1 "Notification that the trigger indicated by the object $*"
SDESC
Notification that the trigger indicated by the object
instances has fired, for triggers with mteTriggerType
'boolean' or 'existence'.
Variables:
  1: mteHotTrigger
  2: mteHotTargetName
  3: mteHotContextName
  4: mteHotOID
  5: mteHotValue
EDESC
#
#
#
EVENT mteTriggerRising .1.3.6.1.2.1.88.2.0.2 "Status Events" Normal
FORMAT Notification that the rising threshold was met for triggers $*
EXEC /usr/local/nagios/libexec/eventhandlers/submit_check_result $r "snmp_traps" 1 "Notification that the rising threshold was met for triggers $*"
SDESC
Notification that the rising threshold was met for triggers
with mteTriggerType 'threshold'.
Variables:
  1: mteHotTrigger
  2: mteHotTargetName
  3: mteHotContextName
  4: mteHotOID
  5: mteHotValue
EDESC
#
#
#
EVENT mteTriggerFalling .1.3.6.1.2.1.88.2.0.3 "Status Events" Normal
FORMAT Notification that the falling threshold was met for triggers $*
EXEC /usr/local/nagios/libexec/eventhandlers/submit_check_result $r "snmp_traps" 1 "Notification that the falling threshold was met for triggers $*"
SDESC
Notification that the falling threshold was met for triggers
with mteTriggerType 'threshold'.
Variables:
  1: mteHotTrigger
  2: mteHotTargetName
  3: mteHotContextName
  4: mteHotOID
  5: mteHotValue
EDESC
#
#
#
EVENT mteTriggerFailure .1.3.6.1.2.1.88.2.0.4 "Status Events" Normal
FORMAT Notification that an attempt to check a trigger has failed. $*
EXEC /usr/local/nagios/libexec/eventhandlers/submit_check_result $r "snmp_traps" 1 "Notification that an attempt to check a trigger has failed. $*"
SDESC
Notification that an attempt to check a trigger has failed.
The network manager must enable this notification only with
a certain fear and trembling, as it can easily crowd out more
important information.  It should be used only to help diagnose
a problem that has appeared in the error counters and can not
be found otherwise.
Variables:
  1: mteHotTrigger
  2: mteHotTargetName
  3: mteHotContextName
  4: mteHotOID
  5: mteFailedReason
EDESC
#
#
#
EVENT mteEventSetFailure .1.3.6.1.2.1.88.2.0.5 "Status Events" Normal
FORMAT Notification that an attempt to do a set in response to an $*
EXEC /usr/local/nagios/libexec/eventhandlers/submit_check_result $r "snmp_traps" 1 "Notification that an attempt to do a set in response to an $*"
SDESC
Notification that an attempt to do a set in response to an
event has failed.
The network manager must enable this notification only with
a certain fear and trembling, as it can easily crowd out more
important information.  It should be used only to help diagnose
a problem that has appeared in the error counters and can not
be found otherwise.
Variables:
  1: mteHotTrigger
  2: mteHotTargetName
  3: mteHotContextName
  4: mteHotOID
  5: mteFailedReason
EDESC
#
#
#
EVENT mteTriggerFired .1.3.6.1.2.1.88.2.0.1 "Status Events" Normal
FORMAT Notification that the trigger indicated by the object $*
EXEC /usr/local/nagios/libexec/eventhandlers/submit_check_result $r "snmp_traps" 1 "Notification that the trigger indicated by the object $*"
SDESC
Notification that the trigger indicated by the object
instances has fired, for triggers with mteTriggerType
'boolean' or 'existence'.
Variables:
  1: mteHotTrigger
  2: mteHotTargetName
  3: mteHotContextName
  4: mteHotOID
  5: mteHotValue
EDESC
#
#
#
EVENT mteTriggerRising .1.3.6.1.2.1.88.2.0.2 "Status Events" Normal
FORMAT Notification that the rising threshold was met for triggers $*
EXEC /usr/local/nagios/libexec/eventhandlers/submit_check_result $r "snmp_traps" 1 "Notification that the rising threshold was met for triggers $*"
SDESC
Notification that the rising threshold was met for triggers
with mteTriggerType 'threshold'.
Variables:
  1: mteHotTrigger
  2: mteHotTargetName
  3: mteHotContextName
  4: mteHotOID
  5: mteHotValue
EDESC
#
#
#
EVENT mteTriggerFalling .1.3.6.1.2.1.88.2.0.3 "Status Events" Normal
FORMAT Notification that the falling threshold was met for triggers $*
EXEC /usr/local/nagios/libexec/eventhandlers/submit_check_result $r "snmp_traps" 1 "Notification that the falling threshold was met for triggers $*"
SDESC
Notification that the falling threshold was met for triggers
with mteTriggerType 'threshold'.
Variables:
  1: mteHotTrigger
  2: mteHotTargetName
  3: mteHotContextName
  4: mteHotOID
  5: mteHotValue
EDESC
#
#
#
EVENT mteTriggerFailure .1.3.6.1.2.1.88.2.0.4 "Status Events" Normal
FORMAT Notification that an attempt to check a trigger has failed. $*
EXEC /usr/local/nagios/libexec/eventhandlers/submit_check_result $r "snmp_traps" 1 "Notification that an attempt to check a trigger has failed. $*"
SDESC
Notification that an attempt to check a trigger has failed.
The network manager must enable this notification only with
a certain fear and trembling, as it can easily crowd out more
important information.  It should be used only to help diagnose
a problem that has appeared in the error counters and can not
be found otherwise.
Variables:
  1: mteHotTrigger
  2: mteHotTargetName
  3: mteHotContextName
  4: mteHotOID
  5: mteFailedReason
EDESC
#
#
#
EVENT mteEventSetFailure .1.3.6.1.2.1.88.2.0.5 "Status Events" Normal
FORMAT Notification that an attempt to do a set in response to an $*
EXEC /usr/local/nagios/libexec/eventhandlers/submit_check_result $r "snmp_traps" 1 "Notification that an attempt to do a set in response to an $*"
SDESC
Notification that an attempt to do a set in response to an
event has failed.
The network manager must enable this notification only with
a certain fear and trembling, as it can easily crowd out more
important information.  It should be used only to help diagnose
a problem that has appeared in the error counters and can not
be found otherwise.
Variables:
  1: mteHotTrigger
  2: mteHotTargetName
  3: mteHotContextName
  4: mteHotOID
  5: mteFailedReason
EDESC
Active Checking
One way to check the fast path by SNMP is to retrieve all processes running on the host by SNMP and then to check the presence of the process for the fast path.
For that task, we’ll use the HOST-RESOURCES-MIB::hrSWRunName OID and the check_snmp_process Nagios plugin.
Installation of check_snmp_process Plugin
Like previously for InfluxDB, we also need to add a plugin and command definition to Nagios Core to check processes by snmp. We will use the check_snmp_process plugin.
First we install its dependencies with:
sudo apt install libsnmp-dev
And then download check_snmp_process from https://sourceforge.net/projects/nagios-snmp/ and compile.
./configure
make
make install
The check_snmp_process executable has to be also copied in the default Nagios’ plugin folder: /usr/lib/nagios/plugins/.
Usage example, to launch a critical alert if there is less than one process of “fp-rte” or uses more than 200 Mb of memory:
./check_snmp_process -H 10.0.2.1 -C public -n fp-rte -w 0,1 -c 0,2 -m 100,200
The main parameters are:
- -n, –name=NAME Name of the process (regexp)
- -w, –warn=MIN[,MAX] Number of processes that will cause a warning
- -c, –critical=MIN[,MAX] Number of processes that will cause an error
(-1 for no critical, MAX must be >0. Ex : -c -1,50) - -m, –memory=WARN,CRIT Checks memory usage (default max of all process) values are warning and critical values in MB
Nagios Command Definition
As with the InfluxDB plugin, we add a new command definition in /etc/nagios4/objects/commands.cfg:
# 'snmp/check_snmp_process' command definition
define command {
 command_name check_snmp_process
 command_line $USER1$/check_snmp_process -H $HOSTADDRESS$ -C $ARG1$ -n $ARG2$ -w $ARG3$ -c $ARG4$ -m $ARG5$
}
Nagios Service Definition
In the host definition of our vRouter, we add one service with arguments to check the presence of the fast path process (called fp-rte) and normal memory consumption (2GB before warning alert and less than 3GB before critical alert).
In /etc/nagios4/objects/myvrouter.cfg:
define service {
 Use 				service
 Host_name			MyvRouter
 Service_description	Check Process Fast Path
 Check_command		check_snmp_process!public!fp-rte!0,1!0,2!2000,3000
}
Checking the Monitoring
After adding new definitions and plugins, Nagios needs to be restarted, with the command:
systemctl restart nagios
Connect on the Nagios Core server (http://10.0.2.2/nagios4) and navigate to the MyvRouter host.
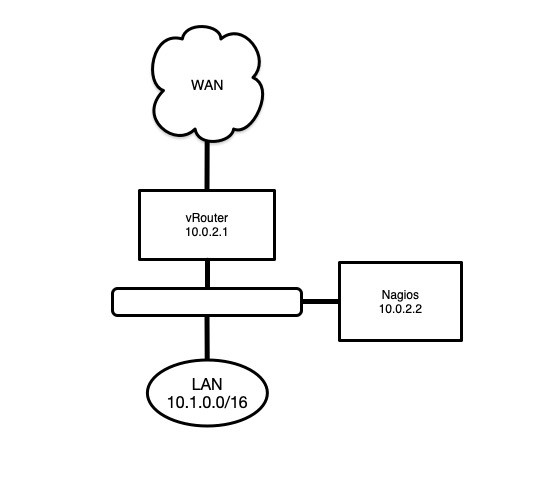
It will show the services monitored and their states.

Each monitored service is detailed in their respective page.
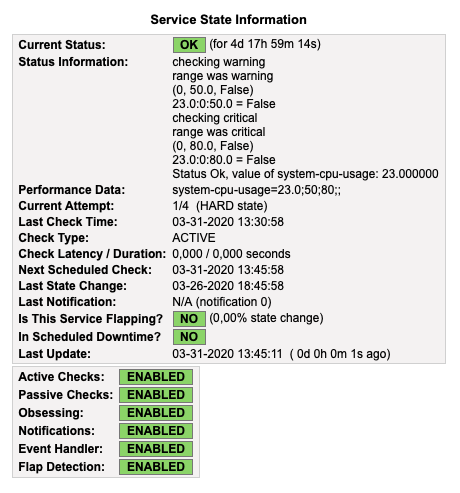
Here is CPU load, checked from InfluxDB, below the warning limit :
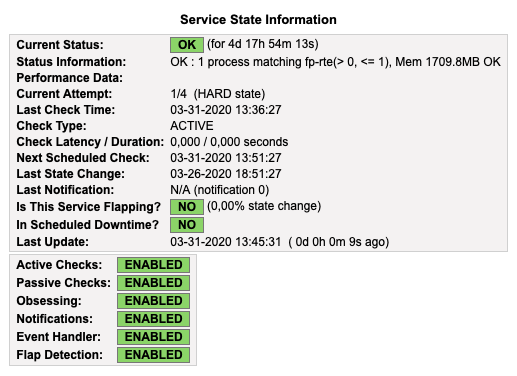
Also for active checking of fast path:
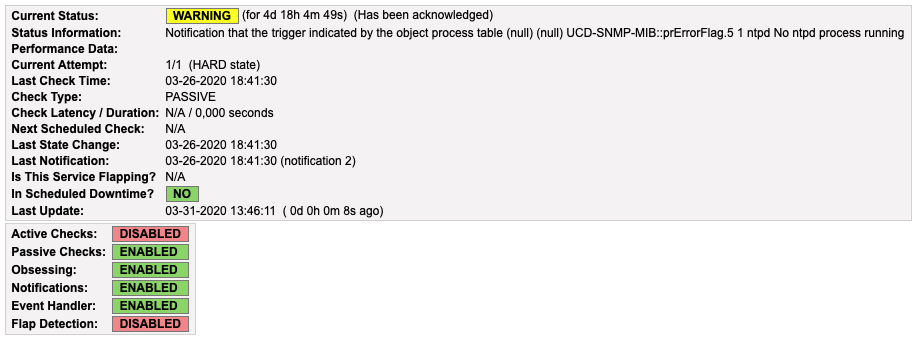
And the service monitoring SNMP traps. Here, a trap was received, notifying a missing NTP server.
Conclusion
Customers using Nagios with 6WIND vRouter can add many monitoring services to their routing infrastructure. With the same basic principles, additional InfluxDB data can also be monitored. We welcome you to check the KPIs section in our vRouter documentation to see additional available KPIs.
Contact us today for a free 6WIND vRouter evaluation, with zero obligation. We look forward to hearing from you.
Michel Galle manages 6WIND IT.